
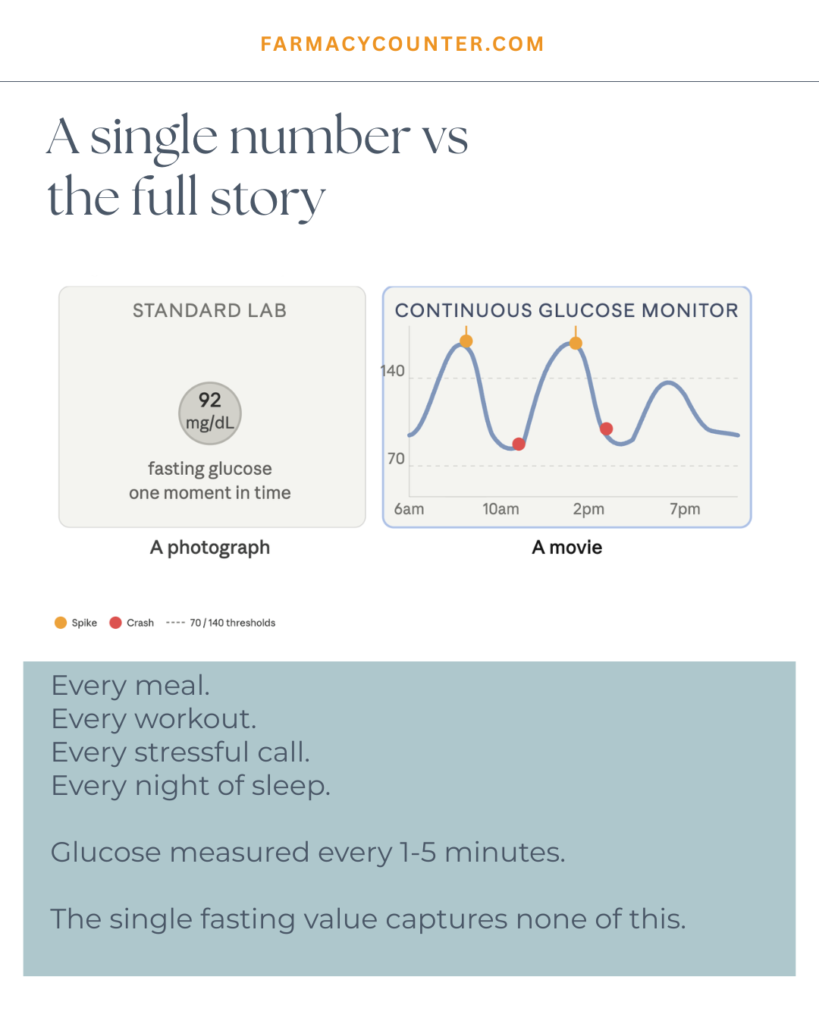
A fasting glucose test is a photograph.
One image, taken under the most favorable conditions possible — after 8 to 12 hours without food, when your metabolic system is at complete rest. It tells you where your blood sugar sits in that single moment. Nothing before it. Nothing after. No context, no movement, no response to the actual circumstances of your life.
A continuous glucose monitor is a movie.
It runs in real time, across real-world conditions, for days or weeks at a stretch. It captures what your blood sugar does when you eat breakfast, when you sit in a stressful meeting, when you sleep, when you exercise, when you skip lunch, when you have a glass of wine. It shows the full arc — the rises, the drops, the recoveries, the patterns — that a single fasting value is completely designed to miss.
The shift from snapshot to movie changes everything about how blood sugar dysregulation can be understood, identified, and addressed.
Why the Standard Test Was Never Built for This
Fasting glucose and HbA1c — the two markers on most standard blood panels — were designed with one purpose: screening for diabetes and pre-diabetes at a population level. For that purpose, they work reasonably well. They catch the late-stage picture when blood sugar has been elevated long enough and consistently enough to move those markers out of range.
But they were never designed to capture the dynamic, moment-to-moment behavior of blood sugar in someone whose fasting values look normal. And that’s precisely where the most clinically relevant information lives for the majority of people experiencing daily energy crashes, persistent cravings, disrupted sleep, and mood instability.
Consider what a fasting glucose test cannot tell you:
It cannot tell you how high your blood sugar spikes after a meal — or how quickly. A spike to 165mg/dL after breakfast that crashes to 72mg/dL two hours later is a physiologically significant event that triggers a stress hormone cascade, drives carbohydrate cravings, and disrupts cognitive function for the rest of the morning. A fasting draw taken the following morning will show nothing.
It cannot tell you whether your blood sugar is stable between meals or quietly oscillating — rising and falling in ways that produce fatigue, irritability, and that restless, dissatisfied feeling that hits two hours after eating even when you ate enough.
It cannot tell you what your blood sugar does overnight. Whether it drops at 3am and triggers a cortisol surge that wakes you up. Whether the dawn phenomenon is driving elevated morning levels that then crash before breakfast. Whether your liver glycogen is running out early and sending a stress signal through your sleep.
It cannot tell you whether a stressful conversation raises your blood sugar without any food involved. Whether exercise drops you too far. Whether your evening craving arrives precisely because your blood sugar has hit its lowest point of the day.
HbA1c adds a 90-day average — which sounds comprehensive but isn’t. An average can be perfectly normal while hiding enormous variability underneath it. Someone spiking to 170mg/dL after every meal and crashing to 65mg/dL two hours later can average out to an entirely unremarkable HbA1c. The average is mathematically clean. The metabolic reality is a daily rollercoaster.

What a CGM Actually Shows
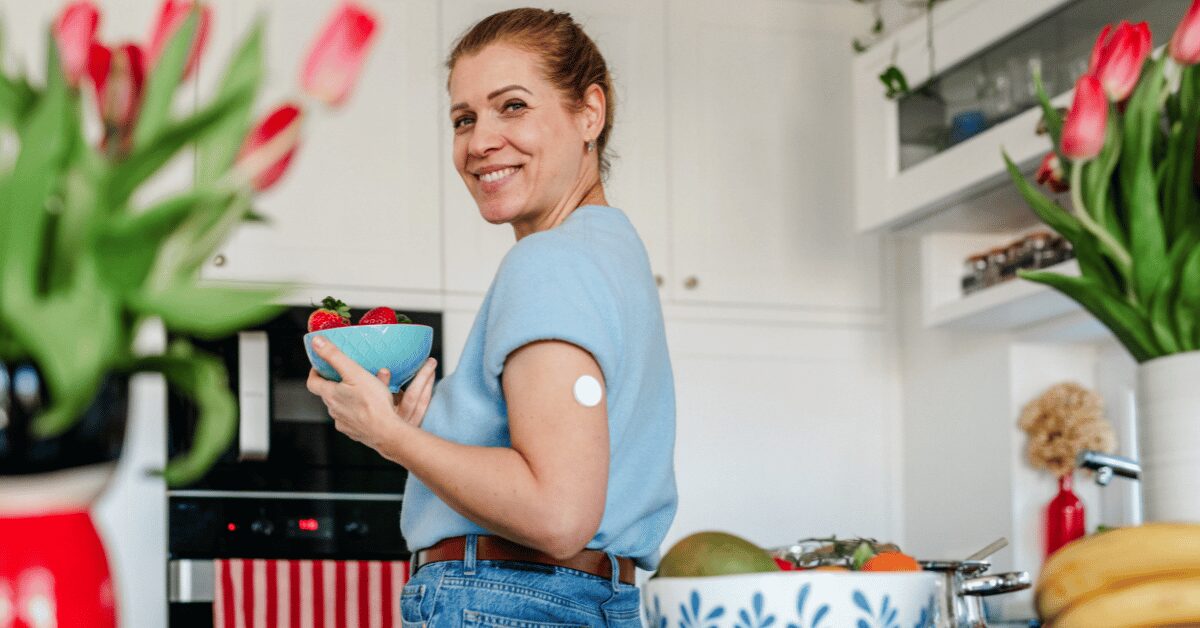
A continuous glucose monitor is a small sensor worn on the upper arm or abdomen that reads interstitial glucose — the glucose in the fluid surrounding your cells — every few minutes and transmits the data to an app in real time.
The result is a continuous trace of your blood sugar across the entire day and night. Every meal. Every spike. Every drop. Every recovery. Every overnight pattern. Two weeks of that data produces a picture of your blood sugar behavior that is categorically more informative than any single lab value.
Here is what that movie typically reveals that the photograph misses.
Postprandial spikes. How high does blood sugar actually go after eating — and how sharply? In functional medicine, a postprandial spike above 140mg/dL at one hour and above 120mg/dL at two hours indicates impaired glucose handling. Many people are regularly spiking well above these thresholds after meals they consider healthy. The CGM makes this visible for the first time. A bowl of oatmeal with fruit. A smoothie. A rice bowl. Foods that feel virtuous and produce a blood sugar response that the body is spending significant metabolic resources managing.
The crash pattern. After a sharp spike, insulin overcorrects. Blood sugar drops below where it started. That drop is what produces the 11am brain fog, the 3pm wall, the inability to concentrate that descends on schedule every day. The CGM shows exactly how far the drop goes, how fast it happens, and what time it predictably arrives. Once you can see the crash, you stop wondering why you feel the way you feel at that hour every day.
Cortisol-driven spikes without food. One of the most revelatory findings for most people wearing a CGM for the first time is watching their blood sugar rise during a stressful meeting, a difficult conversation, or an intense deadline — without eating a single thing. The HPA-glucose axis is real and it’s visible on the trace. Stress activates cortisol. Cortisol signals the liver to produce glucose via gluconeogenesis. Blood sugar rises. Insulin responds. Blood sugar drops. The craving arrives. The whole cycle unfolds with no food involved, and the CGM shows it happening in real time.
The overnight picture. The 3am wake-up is one of the most commonly reported — and most commonly misunderstood — experiences among people with blood sugar dysregulation. CGM data has clarified what’s happening. When liver glycogen runs low overnight, cortisol surges sharply to trigger gluconeogenesis and replenish the supply. That cortisol surge activates the stress response, suppresses melatonin, increases heart rate, and wakes the person up with a racing mind and the conviction that something is wrong. By the time a fasting lab draw happens the following morning, the blood sugar has already normalized. The event has disappeared from the record. The CGM catches it.
Sleep’s effect on the following day. A single night of poor sleep produces measurable insulin resistance the following morning — approximately a 25% impairment in insulin sensitivity. CGM data makes this concrete and personal. You can see the difference in your glucose trace after a good night versus a disrupted one. The morning spike is higher. The post-meal response is more exaggerated. The mid-morning crash arrives sooner. Sleep stops being an abstract wellness recommendation and becomes a visible metabolic variable.
The exercise response. Exercise affects blood sugar in ways that are highly individual and depend on type, duration, intensity, and timing relative to meals. Zone 2 cardio and post-meal walking generally lower blood sugar by driving non-insulin-dependent glucose uptake in skeletal muscle. High-intensity exercise can temporarily raise blood sugar through cortisol and adrenaline release before the clearance effect kicks in. A CGM shows your personal response — which types of movement help most, what timing works best, and how long the effect lasts.
Food response variability. Two people can eat the exact same meal and produce completely different glucose responses — because insulin sensitivity, gut microbiome composition, stress load, sleep quality, and the sequence in which foods were eaten all modulate the postprandial curve. CGM data personalizes the dietary picture in a way that generic nutrition advice simply cannot. You stop following rules about what’s healthy in theory and start understanding what your body actually does with specific foods in specific contexts.

Why This Changes the Approach
In functional medicine, the CGM is not a diagnostic device in the traditional sense. It’s an investigation tool. It answers the question that a fasting lab draw cannot: what is actually happening with this person’s blood sugar across the day and night, under real-world conditions, in response to the actual circumstances of their life?
That answer changes the protocol entirely.
Two people can walk in with identical fasting glucose values and identical HbA1c readings. One of them is spiking sharply after breakfast and crashing by 10am — a meal composition and sequencing issue. The other is producing stress-driven glucose surges throughout the day without any food-related spikes at all — a cortisol issue that will not respond to dietary change alone. A third person’s primary dysregulation is overnight — liver glycogen running out early, a 3am cortisol surge, disrupted sleep, and the cascading effect that has on insulin sensitivity the following day.
Same fasting labs. Three completely different patterns. Three completely different protocols.
The CGM is what makes those patterns visible. And visible patterns can be addressed.
Who This Is For
CGM technology was originally developed for people managing type 1 diabetes, where continuous glucose data is medically necessary for safe insulin dosing. It has since expanded significantly — both in clinical applications and in accessibility.
Over-the-counter CGM options now exist in many markets, available without a prescription and eligible for FSA and HSA spending. They have made real-time glucose monitoring accessible to anyone who wants to understand their metabolic picture — not just those with a diabetes diagnosis.
The candidates who benefit most from CGM investigation are not necessarily people with elevated fasting labs. They are people experiencing the pattern that fasting labs miss entirely: daily energy crashes, predictable cravings, disrupted sleep, mood instability around meals, weight resistance despite careful eating, and the persistent feeling that something is off that nobody has been able to explain.
For those people, two weeks of CGM data is often the first time the pattern has been made fully visible — and the first time the approach can be built around what’s actually happening rather than what a single morning blood draw suggests.

The Photograph and the Movie
A fasting glucose value tells you one thing: where your blood sugar was at rest, on one morning, under optimal conditions.
It says nothing about what your blood sugar does when you eat the foods you actually eat, live the life you actually live, carry the stress you actually carry, and sleep — or don’t sleep — the way you actually sleep.
The continuous glucose monitor tells that story. And once you’ve seen the full movie, the photograph alone stops being sufficient.
Want to understand the full pattern behind your energy, cravings, and mood — including how CGM data fits into the bigger picture? The Blood Sugar Rhythm masterclass walks through exactly what’s been happening in your body and what to do about it.
Watch The Blood Sugar Rhythm masterclass here.
Not sure where your pattern is coming from? The Cravings Root Cause Quiz identifies whether yours is metabolic, hormonal, or stress-driven in two minutes.