
You’ve had bloodwork done.
Probably more than once. Maybe many times — chasing an answer to the fatigue, the weight resistance, the brain fog, the feeling that something is fundamentally wrong even though nobody can tell you what it is.
And every time, you’ve heard the same thing: “Your labs look normal.”
Here’s what I want you to understand: normal and optimal are not the same thing. And more importantly — if the right tests were never ordered, normal doesn’t mean anything at all.
The standard annual panel your doctor runs is designed to catch serious disease. It is not designed to identify the functional metabolic dysfunction that causes years of exhaustion, stubborn weight resistance, and progressive decline in energy and vitality before anything becomes pathological enough to show up on a basic screen.
There is a different set of tests. Tests that actually show what’s happening inside your metabolism — not just whether you’ve crossed the threshold into diagnosable disease.
These are the labs I run on every complex metabolic case. Here’s what each one reveals and why it matters.
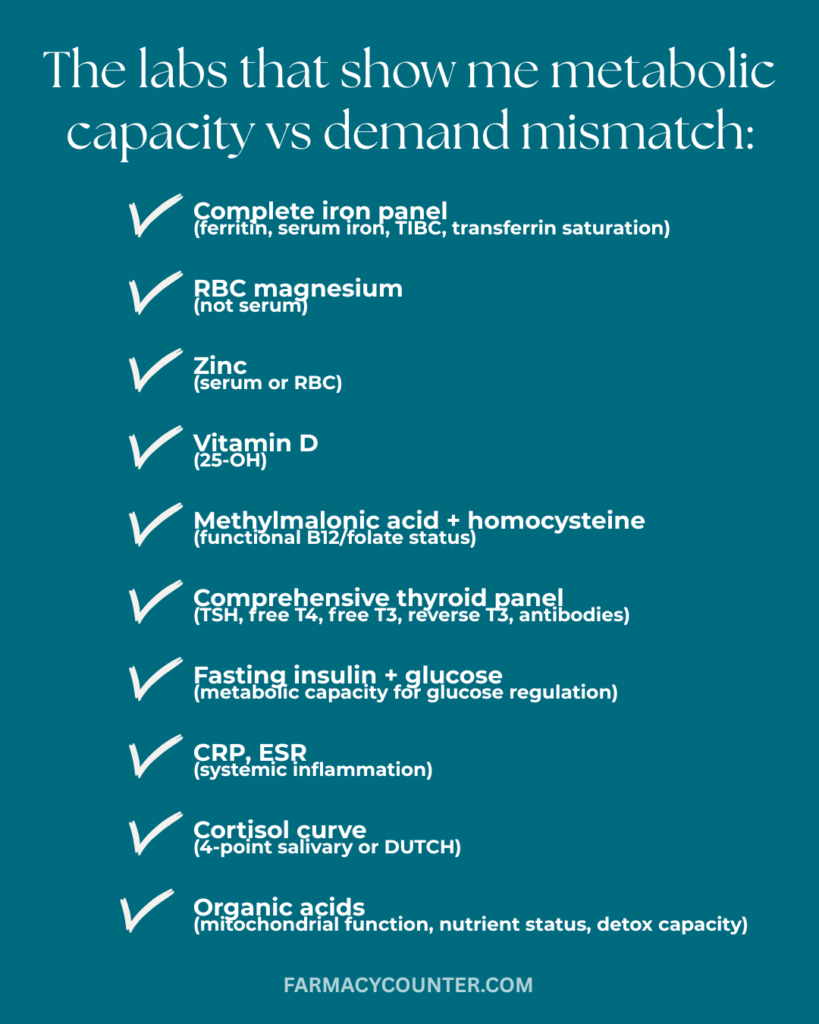
The Complete Iron Panel
(Ferritin, serum iron, TIBC, transferrin saturation)
Most doctors run serum iron at best. Many run nothing at all unless you’re visibly anemic.
The complete iron panel tells an entirely different story. Ferritin — the storage form of iron — is the most metabolically relevant marker, and it’s the one most commonly missed. Levels between 12-30 ng/mL are technically “in range” by standard lab reference values. They are not adequate for optimal metabolic function.
Ferritin below 50 ng/mL impairs mitochondrial ATP production, reduces oxygen transport to cells, suppresses thyroid hormone production, and drives the kind of profound fatigue and exercise intolerance that no amount of sleep fully resolves.
I see patients with ferritin of 14 who have been told their iron is “fine.” It is not fine. It is one of the primary reasons they feel the way they do.
TIBC and transferrin saturation round out the picture — showing whether the body is iron-deficient at the transport level, not just the storage level. You need all four markers to understand what’s actually happening with iron status.
RBC Magnesium
(Not serum magnesium)
This distinction is critical and almost universally ignored in standard care.
Serum magnesium — the version that appears on a standard metabolic panel — measures what’s floating in your bloodstream. It stays “normal” until you are severely, dangerously depleted, because your body pulls magnesium from cells and bone to maintain serum levels. By the time serum magnesium is low, you’ve been functionally depleted for a long time.
RBC magnesium measures what’s actually inside your red blood cells — where magnesium does its work. It reflects true cellular magnesium status, which is what actually matters for the 300+ enzymatic reactions magnesium is required for, including ATP synthesis, glucose metabolism, insulin signaling, and muscle and nerve function.
Optimal RBC magnesium is above 5.5 mg/dL. Most people with chronic fatigue, sleep disruption, muscle cramps, anxiety, and insulin resistance are running significantly below this — with serum magnesium that looks perfectly normal.
Zinc
(Serum or RBC)
Zinc is required for thyroid hormone receptor function — meaning even if your thyroid is producing adequate hormone, insufficient zinc can prevent your cells from responding to it properly.
It’s also essential for insulin signaling, immune function, tissue repair, and the production of stomach acid needed to absorb other nutrients. Deficiency presents as poor wound healing, hair loss, immune dysfunction, and impaired taste — and contributes to thyroid and metabolic dysfunction that standard thyroid panels won’t catch.
Optimal zinc is above 90 µg/dL. Like magnesium, it’s rarely included in standard panels and almost never investigated as a contributor to metabolic symptoms.
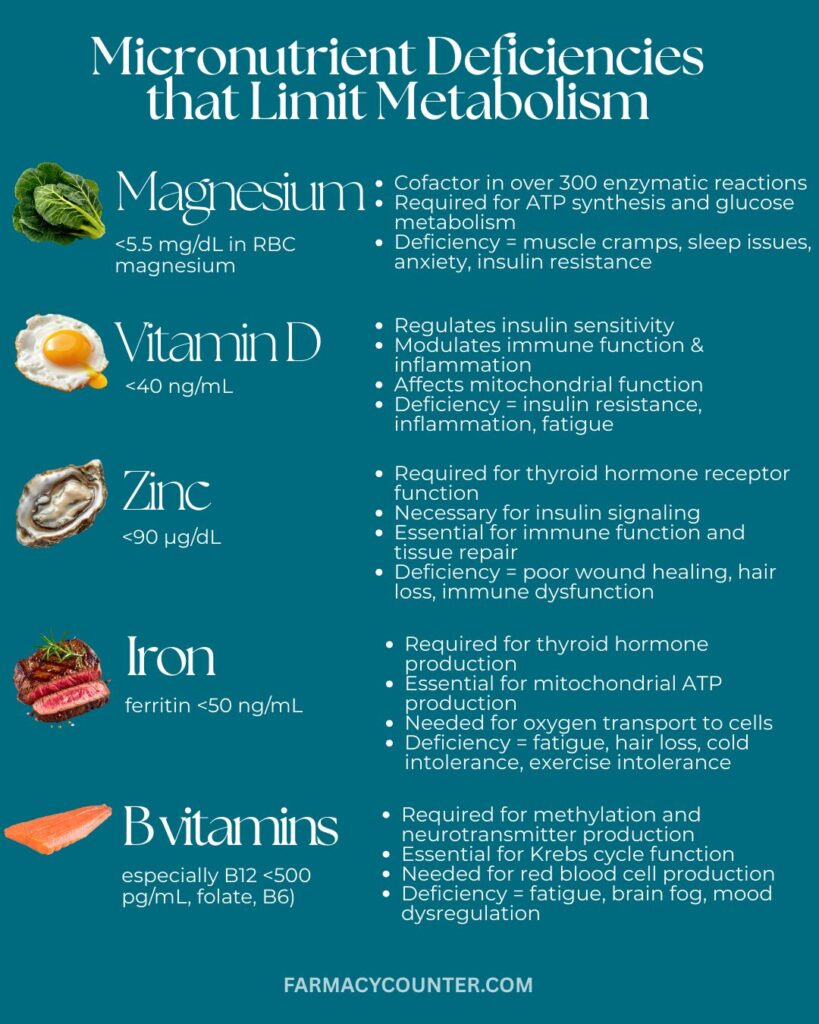
Vitamin D (25-OH)
Vitamin D functions more like a hormone than a vitamin — with receptors in virtually every tissue in the body. It directly regulates insulin sensitivity, modulates immune function and inflammation, affects mitochondrial function, and plays a role in thyroid hormone activity.
Deficiency drives insulin resistance, increases inflammatory markers, and contributes to the deep, unrestorative fatigue that persists regardless of sleep duration.
The standard reference range flags deficiency below 20-30 ng/mL. Optimal metabolic function requires levels above 40 ng/mL — a threshold most people who haven’t been actively supplementing don’t reach, particularly in northern climates or with predominantly indoor lifestyles.
Methylmalonic Acid + Homocysteine
(Functional B12 and folate status)
This is the test almost nobody runs — and one of the most revealing.
A standard B12 blood test tells you how much B12 is in your bloodstream. It does not tell you whether your cells can actually use it. Many people have serum B12 within the normal range who are functionally B12 deficient at the cellular level — particularly those with MTHFR variants that impair B12 metabolism.
Methylmalonic acid (MMA) and homocysteine are metabolic byproducts that accumulate when B12 and folate are functionally insufficient. Elevated MMA indicates B12 deficiency at the cellular level, regardless of what serum B12 shows. Elevated homocysteine indicates either B12, folate, or B6 deficiency — and is independently associated with cardiovascular risk, cognitive decline, and inflammatory burden.
These markers reveal what’s actually happening in your cells, not just what’s circulating in your blood.
Comprehensive Thyroid Panel
(TSH, free T4, free T3, reverse T3, thyroid antibodies)
The standard thyroid test is TSH alone. This is insufficient.
TSH tells you what the brain is signaling the thyroid to do. It does not tell you how much active thyroid hormone is actually reaching your cells, whether conversion from T4 to T3 is impaired, whether reverse T3 is blocking thyroid receptors, or whether an autoimmune process is destroying thyroid tissue.
Free T3 is the active thyroid hormone your cells actually use. It can be low — producing every symptom of hypothyroidism — while TSH remains completely normal. This happens commonly in people with chronic stress, inflammation, calorie restriction, and gut dysfunction, all of which impair T4-to-T3 conversion.
Reverse T3 is an inactive form of thyroid hormone that competes with free T3 for receptor binding. When reverse T3 is elevated — which happens under chronic stress and inflammation — it blocks the active hormone from doing its job. TSH and even free T3 can look normal while reverse T3 is actively blocking thyroid function at the receptor level.
Thyroid antibodies (TPO and thyroglobulin) identify autoimmune thyroid disease (Hashimoto’s) years before TSH becomes abnormal. If antibodies are elevated and nobody is addressing the immune triggers, thyroid tissue continues to be destroyed — silently — while all your thyroid labs look “fine.”

Fasting Insulin + Fasting Glucose
(Metabolic capacity for glucose regulation)
Fasting glucose alone misses insulin resistance in the majority of cases. Your glucose can be perfectly normal while your pancreas is working two to three times as hard as it should to keep it there — pumping out excess insulin to overcome cellular insulin resistance.
Fasting insulin reveals this compensatory hyperinsulinemia that fasting glucose never shows. Optimal fasting insulin is below 5 µIU/mL. Levels above 10 indicate significant insulin resistance even when fasting glucose is normal. Many people with fasting glucose in the 85-95 range have fasting insulin above 15 — a sign of substantial metabolic dysfunction that standard screening completely misses.
The combination of fasting insulin and fasting glucose also allows calculation of HOMA-IR — a validated index of insulin resistance that is far more sensitive than either marker alone.
CRP and ESR
(Systemic inflammation)
High-sensitivity CRP (hsCRP) is the most accessible marker of systemic inflammation. Optimal is below 1.0 mg/L. Values above this — even in the “normal” range — indicate a chronic inflammatory burden that is driving insulin resistance, suppressing thyroid conversion, increasing cortisol demand, and depleting antioxidant reserves.
ESR (erythrocyte sedimentation rate) is a broader marker of immune activation that complements hsCRP. Together they provide a picture of whether chronic inflammation is a significant metabolic burden — information that is almost never included in standard annual bloodwork.
Cortisol Curve
(4-point salivary or DUTCH)
A single morning cortisol blood draw tells you almost nothing useful about HPA axis function.
Cortisol is a rhythm, not a number. It should be highest in the morning (the cortisol awakening response that drives you out of bed), taper through the day, and reach its lowest point in the late evening to allow sleep.
A 4-point salivary cortisol test — collected at waking, mid-morning, afternoon, and evening — maps the actual rhythm across the day. It reveals whether cortisol is too high, too low, or dysregulated in its pattern (inverted, flat, or erratic) in ways that a single blood draw at 8am cannot.
The DUTCH test (Dried Urine Test for Comprehensive Hormones) goes further — showing not just cortisol levels but cortisol metabolism, the cortisol awakening response, and sex hormone status and metabolism in a single test.
HPA axis dysregulation is one of the most common drivers of the fatigue, weight resistance, sleep disruption, and mood dysregulation I see in complex cases — and it is almost never properly assessed in standard care.
Organic Acids Test
(Mitochondrial function, nutrient status, detox capacity)
The organic acids test is the most comprehensive single functional test available for assessing metabolic capacity.
It measures byproducts of cellular metabolism in urine that reveal how efficiently your mitochondria are producing energy, whether specific nutrient deficiencies are impairing metabolic pathways, whether neurotransmitter metabolism is impaired, and how well your detoxification pathways are functioning.
It can identify mitochondrial dysfunction, B vitamin deficiencies, coenzyme Q10 deficiency, oxidative stress, and gut dysbiosis — all from a single urine sample collected at home.
For complex cases where fatigue, weight resistance, and brain fog persist despite addressing the more obvious drivers, the organic acids test often reveals the remaining piece of the puzzle.
Why This Matters for You
If you’ve been told your labs are normal and yet you feel anything but — there’s a real possibility that the right tests were never ordered.
Normal on the wrong tests tells you nothing.
The next step is making sure the right questions are being asked — and the right markers are being measured.
→Complete the Metabolic Assessment here
Once submitted, our team reviews your full symptom profile and determines which testing and next steps are most appropriate for your specific situation. This isn’t a sales process — it’s a clinical review designed to make sure you get the right answer, not just any answer.
Your labs aren’t normal. The right tests just haven’t been run yet.